

Most people think steganography is invisible. It is — to the eye. Statistical analysis doesn’t look at an image the way a person does. It looks at the numbers underneath, and hiding data changes those numbers in ways that are measurable even when nothing looks different on screen.
I build both sides of this. snapWONDERS forensically evaluates whether steganography exists in an image at all — given a file with no prior knowledge of what, if anything, is hidden inside it, what statistical evidence says something was embedded. That discipline is called steganalysis, and it’s the exact opposite of Vaultify, snapWONDERS’ tool for hiding a file inside a photo or video in the first place — the pixels stay visually identical, the file underneath doesn’t. This article is about the first side: what the signals are, how the classic detection methods work, and why “our steganography is undetectable” is a claim that should make you suspicious of whoever’s saying it.
What “invisible” actually means
Visual imperceptibility and statistical imperceptibility are two different properties, and naive steganography tools only solve the first one. A payload hidden by flipping the least significant bit (LSB) of pixel values changes each affected pixel’s brightness by at most one unit out of 256 — genuinely invisible to a human viewer, even under close inspection. But “close to random noise” and “actually random noise” are not the same distribution, and that gap is exactly what statistical steganalysis measures.
LSB Focused
LSB replacement is the simplest form of image steganography, and the easiest to build — which also makes it the clearest case study for what statistical detection actually looks for. Everything in this section works from that one technique: what it changes, and the classic test built specifically to catch it.
The three signals naive LSB embedding leaves
LSB replacement — the simplest and still most common form of image steganography — overwrites the bottom bit of selected pixel values with payload bits. It leaves traces in three places:
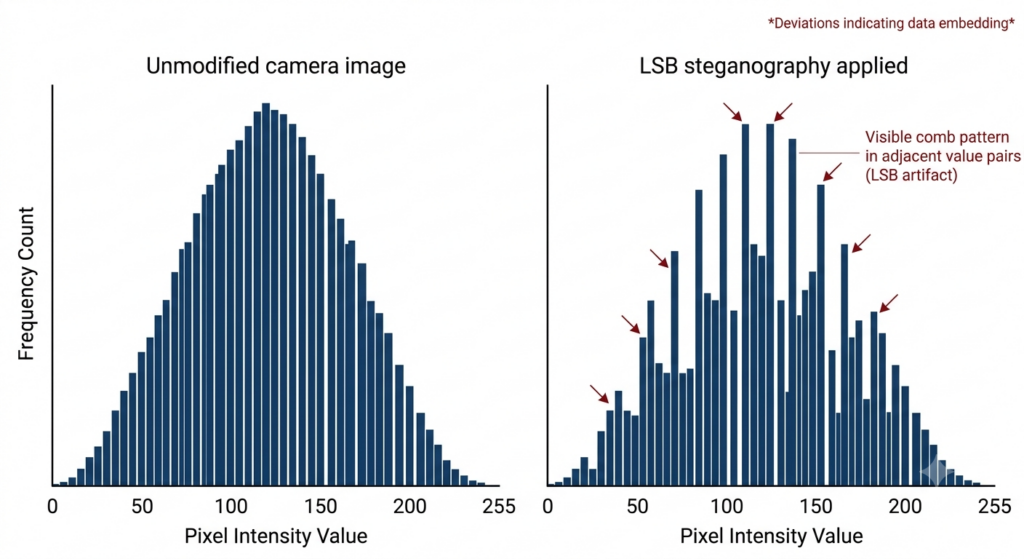
Pixel value pair histograms. Natural photographs have smooth, gradually varying histograms — the count of pixels at value 128 and value 129 are usually close but not identical, and that small difference itself has structure related to the image content. Overwriting LSBs shuffles pixels between adjacent value pairs (2k and 2k+1) in a way that pulls their counts toward equality — a “combing” effect visible directly in the histogram once you know to look for it.
LSB-plane randomness. Camera sensor noise gives the LSB plane of a real photo a small but genuine amount of structure — it isn’t perfectly random. Replacing those bits with payload data (especially encrypted payload data, which is close to statistically random by design) pushes the LSB plane’s entropy measurably closer to true randomness than an unmodified photo’s LSB plane ever gets.
Broken correlation with the rest of the image. In an unmodified photo, the LSB of a pixel has a faint but real relationship to its neighbours and to the higher bit planes — a product of how sensors and lenses actually behave. LSB embedding severs that relationship for every bit it touches, and the more payload you hide, the more of the image loses that correlation.
RS analysis: measuring the asymmetry
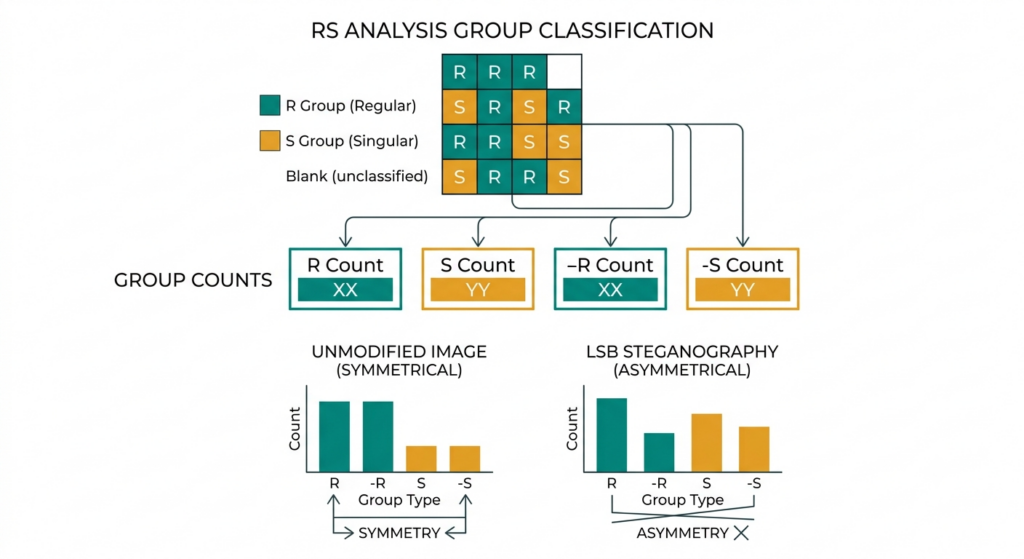
RS analysis is the technique that turned “the LSB plane looks a bit off” into a quantitative test. It works by partitioning the image into small groups of adjacent pixels and applying a discrimination function that measures local smoothness — roughly, how much neighbouring pixel values differ from each other. Natural image regions tend to be locally smooth; noise and texture reduce that smoothness in predictable ways.
Each group is then tested twice: once with a “flip” operation (toggling the LSBs, which is what embedding does) and once with the inverse “shift” operation. Depending on whether flipping increases or decreases the group’s measured smoothness, it gets classified as Regular (R), Singular (S), or unchanged. In an unmodified image, the counts of R and S groups under the flip operation and its inverse hold a specific, well-defined symmetry — R tracks its inverse-counterpart almost exactly, and so does S.
LSB embedding breaks that symmetry, and it breaks it in proportion to how much of the image was modified. That’s what makes RS analysis more useful than a simple presence/absence test — the size of the asymmetry gives a reasonable estimate of the embedding rate, not just a yes or no.
DCT Focused
DCT-domain hiding moves the payload out of the pixels entirely and into JPEG’s own compressed frequency coefficients — a meaningfully harder target for the pixel-based tests above, but not an unsolved one.
How DCT-domain hiding works
Spatial-domain LSB embedding — modifying pixel values directly — is the easiest form of steganography to both build and detect. A more sophisticated approach hides payload bits inside the DCT (discrete cosine transform) coefficients that JPEG compression itself produces, typically favouring mid-frequency coefficients that contribute less to how the image looks. This class of technique is a meaningfully harder target for spatial-domain tests like RS analysis, because the modification never touches a pixel value directly — it happens inside the compressed frequency representation.
Why it’s still detectable
Harder to detect is not the same as undetectable. DCT coefficients in real JPEGs follow well-characterised statistical distributions, and embedding disturbs those distributions in ways that coefficient-histogram analysis and calibration-based methods — comparing a suspect image’s coefficient statistics against a re-compressed or cropped reference version of itself — are built to catch. Every generation of harder-to-detect embedding has been met with a corresponding generation of detection technique built specifically for that domain. This is a general property of the field, not a claim about any one tool’s output.
Beyond LSB and DCT
Spatial-domain and transform-domain hiding are the two broad families this article focuses on, but they’re not the whole picture. Pixel value differencing hides more data in high-contrast regions by exploiting the difference between neighbouring pixels. Palette-based embedding targets the colour-index table of GIF-style images rather than the pixels themselves. The discrete wavelet transform (DWT) spreads a payload across multiple frequency sub-bands instead of one, trading some capacity for resilience against cropping and filtering. Audio and text carriers have their own separate techniques again — spread-spectrum and echo-hiding for audio, whitespace manipulation for documents — each built around what redundancy actually looks like in that medium.
Every one of these has a body of detection research built specifically for it, for the same reason RS analysis exists for LSB: wherever a hiding technique introduces structure that wasn’t there naturally, there’s a statistical test somewhere designed to find it.
What detection confidence actually means
No single statistical test proves presence or absence of hidden data with certainty, in either direction. Some natural images — heavy texture, low light, aggressive prior compression — produce noise statistics that can trip a test tuned for “clean” natural images into a false positive. Embedding methods that deliberately match their footprint to the carrier image’s own local noise characteristics can sit under a single test’s detection threshold entirely.
That’s why credible steganalysis combines multiple independent statistical tests rather than relying on any one of them, and reports a confidence level rather than a binary verdict — because that’s what the underlying evidence actually supports. Any tool that claims guaranteed, universal detection — or, on the other side, guaranteed undetectability — is making a claim about a moving target that neither side of this field has ever been able to make honestly.
Checking a suspect image
snapWONDERS runs statistical steganalysis as part of its forensic analysis pipeline alongside the metadata, device fingerprinting, and manipulation-detection checks covered in earlier articles — the same evidence-combination principle applies: multiple independent signals, reported as a confidence level.
→ Run a suspect image through snapWONDERS
Close
Every embedding method leaves a footprint somewhere in the statistics. The only question is which test is built to find it.
Kenneth Springer is the founder of snapWONDERS and built Vaultify, its AI steganography platform. Perceptual redundancy in images — the fact that not every pixel matters equally to a human viewer — is something he was already writing about in 2024, well before Vaultify existed: an early piece on AI and image compression. Working on both the hiding side and the detection side of steganography today means the statistical reasoning in this article runs in both directions — understanding how embedding disturbs an image’s statistics is the same knowledge whether you’re building the embedding or building the test that catches it. The hiding side got its own follow-up article, on how Vaultify decides where to hide data in the first place. snapWONDERS forensic analysis — no account required.